Why didn’t the chicken cross the road? Because pedestrian Level-Of-Service was below “C”.



Why didn't the chicken cross the road?
Because pedestrian Level-Of-Service was below "C".
Let me explain. Last week I attended the ProBike/ProWalk conference in Chattanooga, Tennessee. It was a wonderful event populated by a tribe of nonmotorized transportation planners and activists who do good work and have lots of fun too - my sort of folks. One highlight was a presentation on new, multi-modal Level-Of-Service (LOS) indicators which are starting to revolutionize transport planning.
Level of Service refers to Performance Indicators that rate transport system service quality from A (best) to F (worst), similar to elementary school grades. Planners use LOS rating to identify problems and prioritize improvements. Facilities with LOS below C are generally considered to fail and therefore require improvement.
This approach seems rational and fair, but is really anything but. The problem is that, until now, this system only considered automobile travel conditions.
For example, conventional analysis generally defines roadway expansion as a transport system improvement, although wider roads and faster vehicle traffic degrade walking and cycling conditions (called the Barrier Effect or Severance), and therefore public transit travel since most transit trips have walking links. Conventional analysis ignores these negative impacts, which skews planning decisions to favor automobile mobility to the detriment to other forms of access. The result is automobile dependency and sprawl.
But that is starting to change. During the last decade a team of leading transport engineers and planners sponsored by the National Cooperative Highway Research Program developed multi-modal Level-Of-Service rating systems. Their research results are published in the report, Multimodal Level Of Service Analysis For Urban Streets, and subsequent Publications that provide detailed guidance for measuring the quality of walking, cycling and public transport travel under specific conditions, and therefore the impacts of particular system changes, either positive or negative, on the ease of travel by these modes.
The results are already being used by progressive planning agencies. For example, Jacksonville, Florida developed a Multi-Modal Transportation Plan which uses pedestrian and cycling Level-Of-Service ratings to prioritize walking and cycling improvements, as shown in the following maps.
Pedestrian LOS Map - Jacksonville, FL

This map illustrates pedestrian level-of-service, which shows the quality of walking conditions.
Proposed Pedestrian Improvement Map - Jacksonville, FL

This map illustrates where walking facility improvements will be implemented.
Cycling LOS Map - Jacksonville, FL
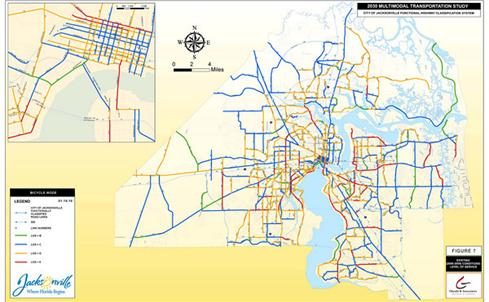
This map illustrates bicycling level-of-service, which shows the quality of cycling conditions.
Cycling Improvement Map - Jacksonville, FL

This map illustrates where cycling facility improvements will be implemented.
Automobile LOS is relatively easy to calculate, based on volume-to-capacity ratios (abbreviated V/C) to quantify traffic congestion. Other LOS ratings require more data, such as the presence and quality of sidewalks or paths; the speed, volume, separation distance, and portion of heavy vehicles in adjacent motor vehicle traffic; and the average delay that pedestrians and cyclists experience when they try to cross the roadway. However, much of this information is already collected or can be during regular field surveys, so with good planning communities can implement multi-modal transport system performance evaluation.
These multi-modal LOS methods are being incorporated into the upcoming revision of the Highway Capacity Manual (HCM), which is the main reference document used by transport planners and engineers to evaluate roadway capacity and service quality. The 2010 Edition, and its support software, will provide guidance and specific computation methodologies for evaluating walking, cycling and public transport, as well as automobile travel conditions. This will be a great leap forward in creating a more level playing field between modes, and therefore a more efficient and equitable transport system.
Special note: The current Wikipedia Level-Of-Service entry contains little information on multi-modal LOS. Please contact me ([email protected]) if you would like to help update it, particularly if you have experience editing Wikipedia.
For More Information
Richard Dowling, et al. (2008), Multimodal Level Of Service Analysis For Urban Streets, NCHRP Report 616, Transportation Research Board (www.trb.org); at http://trb.org/news/blurb_detail.asp?id=9470; User Guide at http://onlinepubs.trb.org/onlinepubs/nchrp/nchrp_w128.pdf.
FDOT (2002), Quality/Level of Service Handbook, Florida Department of Transportation (www.dot.state.fl.us); at www.dot.state.fl.us/planning/systems/sm/los/los_sw2.shtm. Kittelson (2003), Transit Capacity and Quality of Service Manual, Second Edition, Report 100, Transit Cooperative Research Program, TRB (www.trb.org); at www.trb.org/news/blurb_detail.asp?id=2326.
Christopher Leinberger (2007), Footloose and Fancy Free: A Field Survey of Walkable Urban Places in the Top 30 U.S. Metropolitan Areas, Brookings Institution (www.brookings.edu); at www.brookings.edu/~/media/Files/rc/papers/2007/1128_walkableurbanism_leinberg/1128_walkableurbanism_leinberger.pdf.
Todd Litman (2008), Introduction to Multi-Modal Transport Planning, VTPI (www.vtpi.org); at www.vtpi.org/multimodal_planning.pdf.
Nathan McNeil (2010), Bikeability and the Twenty-Minute Neighborhood: How Infrastructure and Destinations Influence Bicycle Accessibility, Portland State University (www.ibpi.usp.pdx.edu); at www.ibpi.usp.pdx.edu/media/McNeil_Bikeability_June2010.pdf.
Ronald Milam and Chris Mitchell (2008), Conventional Level of Service Analysis, Thresholds, and Policies Get a Failing Grade, TRB Annual Meeting (www.trb.org); at http://opr.ca.gov/sch/pdfs/LOS_Climate_Change_Smart_Growth.pdf. NYC (2006), New York City Pedestrian Level of Service Study, New York City (www.nyc.gov); at www.nyc.gov/html/dcp/html/transportation/td_ped_level_serv.shtml.
PPS (2008), A Citizen's Guide to Better Streets, Project for Public Spaces (www.pps.org); at www.pps.org/pdf/bookstore/How_to_Engage_Your_Transportation_Agency_AARP.pdf.
Quality/Level of Service Website (www.dot.state.fl.us/planning/systems/sm/los/default.shtm) by the Florida Department of Transportation provides extensive information on multi-modal level-of-service evaluation tools and professional development programs. TRB (2010), Highway Capacity Manual, Transportation Research Board (www.trb.org); at http://rip.trb.org/browse/dproject.asp?n=16893.
Walkability Tools Research Webpage (www.levelofservice.com) provides guidance and data for Community Street Review (CSR) analysis of walkability.
Wilbur Smith (2008), Traffic & Transportation Policies and Strategies in Urban Areas in India, Ministry of Urban Development (www.urbanindia.nic.in); at http://urbanindia.nic.in/moud/programme/ut/Traffic_transportation.pdf.

Changing Travel Demands: Implications for Planning
The graph below shows the most recent USDOT vehicle-travel data covering the last 25 years. Although vehicle-miles of travel (VMT) grew steadily during most of the Twentieth Century, in recent years the growth rate stopped and even declined a little. It is now about 10% below where it would have been had past trends continued.
Valuing The Precious Hours Of Our Lives
Time is a limited and valuable resource. As much as possible, people should spend the precious hours of their lives in the most satisfying and productive possible ways. This has important implications for transportation planning, since most people spend a significant amount of time in transport, and travel time savings are often the greatest projected benefits of transport projects such as roadway and transit service improvements.

Funding Multi-Modalism
The new Republican Party Platform wants to stop spending federal fuel tax funds on walking, cycling, and public transit. That would be unfair and inefficient.

Planetizen Federal Action Tracker
A weekly monitor of how Trump’s orders and actions are impacting planners and planning in America.

‘Going backwards:’ Baltimore mayor, students rally against state's transit funding plan
Maryland's proposed six-year plan provides no funding for Baltimore’s BMORE bus program and reduces its road maintenance funding.

Detroit to transform waterfront with $2.2 billion investment
Developers will convert about 18 acres of unused parking lot space into civic spaces.

HUD modernizes 50-year-old manufactured housing framework
The Next Generation Manufactured Housing Action Plan establishes new energy-efficiency standards for manufactured homes, and new guidelines for anchoring them.

New CA housing laws tear down development red tape
Recently-signed legislation makes building starter homes and ADUs cheaper and faster in California.

Metrolink finishes first expansion in 20 years
The transit agency is now one of very few in the United States to connect two major airports.

FREE Course: Walkable City 1: Why Walkability?
After describing his path towards focusing on walkability as the essence of good planning, Jeff Speck marches through his five principal reasons for making more walkable places.
Reinventing Malls: Planning Alchemy—Turning Gray Fields Into Gold
The course focuses on the opportunities and imperatives that shape reinvention of mall sites.

One Hundred Miles
County of Mendocino
planning NEXT
The Architects Foundation
University of Cincinnati Online
Montrose County
Northern Illinois Transit Authority (NITA)
The Pocatello Development Authority

