


Contrary to popular assumptions, large, transit-oriented cities have lower crime rates than smaller, automobile-oriented cities. Jane Jacobs was right! This column discusses this phenomenon and its implications for transport and land use planning.

If you believe that large cities are dens of violence and crime, you are understandably wrong. First, let’s look at why you might think so, then examine what data actually indicate, and discuss their implications for transportation and land use planning.
It is true that per capita crime rates tend to increase as communities grow in size from a village to a town, to a city, and that crime rates increased between 1955 and 1976, as indicated in this classic graph by Claude Fischer.
Figure 1 Violent Crime Rates By City Size

Violent crime rates increased with city size and grew rapidly between 1955 and 1976, the period of growing automobile travel and suburbanization.
Several factors can help explain these patterns. The positive association between community size and crime rates probably reflects differences in community cohesion: smaller community residents are more likely to know and befriend their neighbors, or described differently, city residents experience more anonymity and alienation. Crime rate increases during last half of the twentieth century where probably caused by a combination of increased mobility and sprawl (people traveled more and were less connected to their community), large numbers of young Baby Boomers (young people tend to commit more crimes), and high levels of violence-inducing lead toxin in urban residents from gasoline and paint.
It is also true that the highest crime rates tend to occur in dense central city neighborhoods and the lowest in low-density suburbs. This pattern can be explained by income variations: high crime rate urban neighborhoods have concentrated poverty and associated problems such as alcohol and drug abuse, and mental illness, while the low crime rate suburbs have high incomes, in part because low-income people are excluded by automobile dependency.
These patterns do not mean that large cities are necessarily dangerous, that total crime increases if people move to large cities, or that individuals face greater risk by moving to urban neighborhoods. Most violent crimes, particularly murders (about 70%), resulted from conflicts between acquaintances; their risk varies geographically due to demographic factors such as poverty, but does not increase when people move from one area to another.
Crime rates peak in medium size cities (250,000 to 500,000 residents) and are significantly lower (23% lower violent crime rates, and 32% lower property crime and vehicle theft rates) for the largest cities (over a million residents), as illustrated in Figure 2.
Figure 2 Crime Rates By Population Group
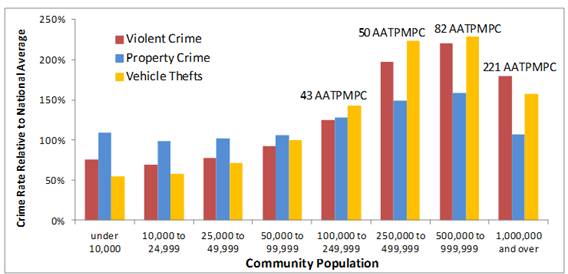
Crime rates tend to increase as community population grows, peaks at about 500,000 residents, and declines significantly for the largest cities, which also have the highest transit ridership rates (AATPMPC = Average Annual Transit Passenger-Miles Per Capita).
This is a fairly recent phenomenon. Crime rates were much higher during the last quarter of the twentieth century, but subsequently declined significantly, particularly in large cities, as illustrated in Figure 3. These reductions probably reflect a combination of aging population (older people commit fewer crimes), lower blood lead levels, improved passive surveillance (more responsible people who can report potential threats, due in part to mobile telephones), improved policing methods, and declining drug use.
Figure 3 Crime Rates Trends (FBI 1995-2012, Tables 16)
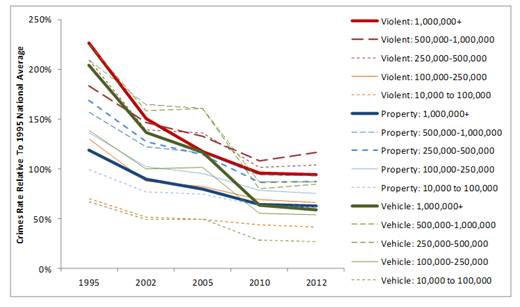
Crime rates declined significantly during the last two decades, particularly in large (more than a million resident) cities. Large cities now have lower crime rates than medium-size cities (250,000 to one million).
Of particular interest are the relatively low crime rates in large cities. Several factors may help explain this:
- More compact, mixed, walkable neighborhoods increases surveillance (more responsible people who can report possible threats) and community cohesion due to more businesses, residents and pedestrians, what author Jane Jacobs called, “eyes on the street.” Research does indicates that at the neighborhood scale, increased urban density (Christens and Speer 2005; Li and Rainwater 2000) and mix (Browning, et al. 2010) are associated with lower crime rates, particularly violent crimes.
- Large cities may offer low-income residents more economic opportunities through better access to education and employment opportunities provided by high quality public transit. Research indicates that the number of jobs and services available within a given travel time increases significantly with increased urban densities (Levine, et al. 2012).
- Large cities tend to have higher average incomes and education levels, although they also tend to have greater income disparities, with large numbers of both high- and low-income households.
- Larger cities may have better policing and social services, and denser neighborhoods may have faster police response.
- Public transit security efforts (security patrols and cameras, and passenger education efforts) may have positive spillover safety impacts which reduce crime throughout a neighborhood.
- Larger cities tend to have lower vehicle ownership rates, which may reduce vehicle-related crime rates.
In other words, large, compact, multi-modal cities have some attributes that increase crime and others that suppress crime. During the second half of the twentieth century, crime–stimulating factors overwhelmed crime-reducing factors causing crime rates to grow, but many of the crime-stimulating factors have peaked and the crime-suppressing factors are growing, making cities safer.
Planning decisions can support these positive trends: policies that increase development density and mix, encourage walking and cycling, improve poor people’s education and employment opportunities, improve police response speed and policing coordination, and reduce per capita vehicle ownership can help reduce crime.
There is empirical evidence supporting the conclusion that multi-modal transport planning and smart growth policies increase community safety and security. Crime rates tend to decline with increased public transit ridership, as illustrated in Figure 4. Since transit, walking and cycling are complementary, walking and cycling are probably also negatively associated with crime rates (all else being equal, the more people walk in a neighborhood the safer it is).
Figure 4 Crime Rates Versus Transit Ridership

Crime rates, particularly property crime rates, tend to decline with increased transit use (annual transit passenger-miles per capita).
Public transit travelers face far lower property crime risks than motorists. According to FBI data, in 2012 U.S. police departments reported 638,964 motor vehicle thefts, 406,309 accessory thefts and 1,287,331 non-accessory thefts from motor vehicles, totaling 2,332,604 thefts, approximately four hundred times the 5,959 thefts reported on transit properties. These statistics understate total vehicle crime since they do not include vehicle vandalism. Automobile travel has about 20 times greater commute mode share, 30 times more passenger-hours, and 80% more passenger-trips than transit; by any of these measures automobile travel has a far greater property crime rate than transit.
The lower crime rates associated with alternative modes can provide large economic savings. Property crimes against pedestrians, cyclists and transit passengers are both fewer and lower in value than automobile crimes: they typically involve the theft of a telephone, wallet or bicycle worth a few hundred dollars, compared with a typical automobile crime which involves a vehicle theft or vandalism that costs a few thousand dollars. For example, in 2012, the New York City Region averaged 125 annual vehicle thefts per 100,000 residents, which costs about $7.50 per capita (assuming $6,019 per theft), compared with 476 vehicle thefts per 100,000 residents in automobile-oriented San Bernardino County, costing about $30 per capita. Taking into account the other motor-vehicle crimes (thefts from vehicles and vehicle vandalism), crime costs appear to be $50 to $150 lower per capita annual in transit-oriented cities than in automobile-dependent cities. If true, these crime cost savings alone could justify large increases in public transit investment.
This suggests that improving walking, cycling and public transit, and smart growth development policies, tend to increase safety and security. This conclusion is very different from common perceptions because conventional crime risk analysis fails to distinguish between crime shifts (the same number of crimes occur, in another location or to other people) and crime reductions (fewer crimes occur). The traditional response to crime was for individuals and communities to try to distance themselves from higher risk populations: households relocate from cities to suburbs, and neighborhoods tried to exclude lower-income households by discouraging cheaper and multi-family housing development. These solutions fail to address the root causes of crime, such as poverty and alienation; on the contrary, by concentrating poverty, isolating people from their neighbors and reducing passive surveillance they tend to increase crime risk.
In contrast, policy and planning decisions that improve transport options (better walking, cycling and public transit) and support smart growth development can help reduce total crime risk in various ways, as summarized in Table 1.
Table 1 Smart Growth Policy Impacts on Urban Crime Factors
|
Crime Risk Factor |
Impacts of Improved Transport Options and Smart Growth |
|
Concentration of poverty |
Mixed development encourages wealthy and poor residents to locate close together, reducing crime concentration. |
|
Natural surveillance (responsible businesses, residents and by-passers who would report threats.) |
Increased. More businesses, residents and by-passers provide “eyes on the street.” |
|
Vulnerable population’s economic opportunity |
Improved. Poor people have better access to education and employment. |
|
Policing efficiency and response times |
More compact, mixed density development increases policing efficiency and reduces response times. |
|
Transit security |
Increased transit ridership makes transit security efforts more efficient (lower costs per passenger for a given level of service), which justifies expanded security programs. |
|
Motor vehicle ownership |
Tends to reduce total vehicle ownership and associated crime risks |
Improving transportation options and smart growth development policies tends to reduce crime risk factors, and so reduce total crimes rather than simply shifting the location of crimes.
These factors can result in a self-reinforcing cycle of more responsible (non-criminal) urban neighborhood residents, pedestrians and public transit users, which improves urban services, which improves economic opportunities, reduces crime rates, and reduces fear and the stigma of urban living.
Figure 5 The Positive Security Cycle

Communities become safer as more non-criminals walk, bike and use public transit, and development is more compact and mixed, creating a positive feedback cycle.
This is not to deny that urban residents and transit users sometimes face crime risks and discomforts. These reflects the profiles of the people who live in cities and use public transit: although most are responsible, considerate and clean, a portion have conditions associated with crime and anti-social behavior including poverty, drug addiction and mental illness.
Actual crime risk varies depending on conditions. For example, transit travel is usually quite safe due to surveillance by employees, passengers and by-passers. Risks may be higher when walking or cycling on isolated paths to access stops and stations, although even these risks are usually modest, no greater than the risks motorists face walking to and from parked cars, or pet owners face when walking a dog. Transit agencies can reduce crime risks by implementing more security systems (security patrols and cameras, and emergency alarms), through crime prevention through environmental design and neighborhood watch programs. Individuals can reduce their own crime risks by carrying a mobile telephone and avoiding high risk situations, for example, somebody who normally travels by public transit may hire a taxi when returning at night from an isolated destination.
This is an important and timely issue because misplaced fear is often a major obstacle to efforts to encourage more efficient travel and development patterns. Most people assume that walking, cycling and public transit are more dangerous that automobile travel, and that denser, mixed-use, urban neighborhoods are more dangerous than more sprawled suburbs. As this column shows, there is some truth, but a lot of inaccuracy, in these assumptions.
The belief that cities are dangerous is ultimately based on the assumption people are fundamentally bad, so more people in an area increases conflict and crime. Research does not support these assumptions – accounting for demographic factors such as concentrated poverty, crime rate decline rather than increase with increased urban density.
Crime is, of course, just one type of risk affected by planning decisions: traffic accidents and sedentary living tend to injure, disable and kill more people than crimes. These risks also tend to decline in more compact, multi-modal communities.
This is exciting research. To my surprise, there is relatively little information on the relationships between transportation and land use patterns and crime risk suitable for planning or for reassuring urban residents and transit passengers of their overall safety and security. I am incorporating it into my report, Safer Than You Think! Revising the Transit Safety Narrative, and hope to expand this research into other areas. Please let me know if you have related information that I overlooked, or suggestions on how to perform this research.
For More Information
Christopher R. Browning, et al. (2010), “Commercial Density, Residential Concentration, and Crime: Land Use Patterns and Violence in Neighborhood Context,” Journal of Research in Crime and Delinquency, Vol. 47, No. 3, pp. 329-357.
Claude Fischer (1980), “The Spread of Violent Crime From City to Countryside, 1955-1976,” Rural Sociology, Vol. 45, No. 3, pp. 416-434; at http://madeinamericathebook.files.wordpress.com/2011/06/fischer_spread-of-violent-crime_rursoc_1980.pdf
Edward L. Glaeser, Matthew E. Kahn and Jordan Rappaport (2000), Why Do the Poor Live in Cities?, Discussion Paper Number 1891, Harvard Institute of Economic Research, (http://econweb.fas.harvard.edu).
Jonathan Levine, Joe Grengs, Qingyun Shen and Qing Shen (2012), “Does Accessibility Require Density or Speed?” Journal of the American Planning Association, Vol. 78, No. 2, pp. 157-172.
Jianling Li and Jack Rainwater (2000), The Real Picture of Land-Use Density and Crime: A GIS Application, presented at the Twentieth Annual ESRI International User Conference in San Diego, California, June 26-30, 2000.
Todd Litman (2013), Safer Than You Think! Revising the Transit Safety Narrative, Victoria Transport Policy Institute.
Todd Litman and Steven Fitzroy (2012), Safe Travels: Evaluating Mobility Management Traffic Safety Impacts, Victoria Transport Policy Institute.
Jessica Wolpaw Reyes (2007), Environmental Policy as Social Policy? The Impact of Childhood Lead Exposure on Crime, Working Paper No.13097, National Bureau of Economic Research (www.nber.org).


The Link Between Urban Design and Crime
A meta-study shows that public realm interventions can help reduce crime rates.
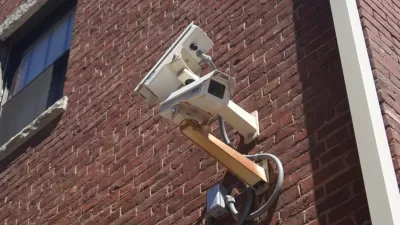
Op-Ed: Facial Recognition on Transit Goes a Step Too Far
Despite its insistence that the technology would only target criminals, Dallas Area Rapid Transit (DART) should reconsider using facial recognition software to address crime. The potential for abuse may be too high.
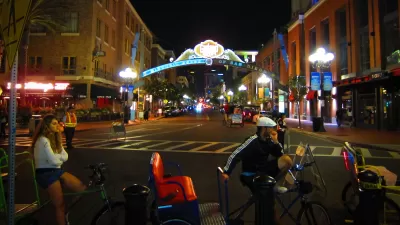
What Makes San Diego Walkers Stop So Much?
San Diego's downtown street grid features smaller blocks than almost all other major U.S. cities. Small blocks mean more intersections, less distance between them, and a lot of interrupted bipedaling. Bill Adams reviews some potential fixes.

Planetizen Federal Action Tracker
A weekly monitor of how Trump’s orders and actions are impacting planners and planning in America.

Restaurant Patios Were a Pandemic Win — Why Were They so Hard to Keep?
Social distancing requirements and changes in travel patterns prompted cities to pilot new uses for street and sidewalk space. Then it got complicated.

Map: Where Senate Republicans Want to Sell Your Public Lands
For public land advocates, the Senate Republicans’ proposal to sell millions of acres of public land in the West is “the biggest fight of their careers.”

Maui's Vacation Rental Debate Turns Ugly
Verbal attacks, misinformation campaigns and fistfights plague a high-stakes debate to convert thousands of vacation rentals into long-term housing.

San Francisco Suspends Traffic Calming Amidst Record Deaths
Citing “a challenging fiscal landscape,” the city will cease the program on the heels of 42 traffic deaths, including 24 pedestrians.

California Homeless Arrests, Citations Spike After Ruling
An investigation reveals that anti-homeless actions increased up to 500% after Grants Pass v. Johnson — even in cities claiming no policy change.
Urban Design for Planners 1: Software Tools
This six-course series explores essential urban design concepts using open source software and equips planners with the tools they need to participate fully in the urban design process.
Planning for Universal Design
Learn the tools for implementing Universal Design in planning regulations.
Heyer Gruel & Associates PA
JM Goldson LLC
Custer County Colorado
City of Camden Redevelopment Agency
City of Astoria
Transportation Research & Education Center (TREC) at Portland State University
Camden Redevelopment Agency
City of Claremont
Municipality of Princeton (NJ)