


A new demographic tool from the USDA compiles data about food choices and characteristics, allowing the creation of detailed maps. Edible Geography wonders what using food as a metric will tell us about the U.S.
The Food Environment Atlas was jointly developed by the USDA, the Centers for Disease Control, the National Cancer Institute, the National Farm-to-School Network, and the University of Illinois at Chicago, and it compiles nearly 100 indicators.
"The Atlas currently maps ninety food environment indicators, divided into three broad categories. "Food Choices" includes both measurements of food access and consumption, from the number of supermarkets to per 1000 people to restaurant expenditures per capita. "Health and Well-Being" tracks dietary outcomes, such as hunger, diabetes, and obesity. And "Community Characteristics" adds an extra level of demographic data, including income levels and metro/non-metro status.
The idea, then, is that researchers, policy-makers, and individuals can compare counties across America, comparing and analysing the correlation between food choice, health outcomes, and population characteristics. So, what do you see when you look at America using food as the metric?"
FULL STORY: United States of Food


Trump Cuts Decimate Mapping Agency
The National Geodetic Survey maintains and updates critical spatial reference systems used extensively in both the public and private sectors.

A Visual Celebration of Manhattan’s Chinatown Elder Community, Through Food
Lanterns, cafeteria trays, and community connection take center stage in this stunning photo essay.
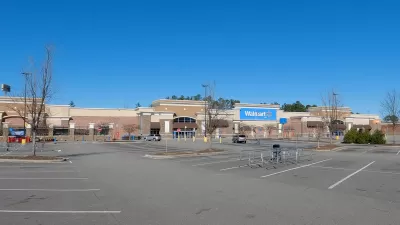
How Smaller Supermarkets Could Transform American Communities
Bigger is not always better.

Planetizen Federal Action Tracker
A weekly monitor of how Trump’s orders and actions are impacting planners and planning in America.

The Simple Legislative Tool Transforming Vacant Downtowns
In California, Michigan and Georgia, an easy win is bringing dollars — and delight — back to city centers.
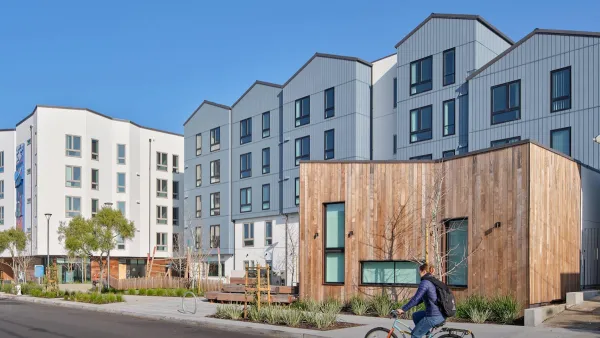
San Francisco's School District Spent $105M To Build Affordable Housing for Teachers — And That's Just the Beginning
SFUSD joins a growing list of school districts using their land holdings to address housing affordability challenges faced by their own employees.

In More Metros Than You’d Think, Suburbs are Now More Expensive Than the City
If you're moving to the burbs to save on square footage, data shows you should think again.

The States Losing Rural Delivery Rooms at an Alarming Pace
In some states, as few as 9% of rural hospitals still deliver babies. As a result, rising pre-term births, no adequate pre-term care and "harrowing" close calls are a growing reality.

The Small South Asian Republic Going all in on EVs
Thanks to one simple policy change less than five years ago, 65% of new cars in this Himalayan country are now electric.
Urban Design for Planners 1: Software Tools
This six-course series explores essential urban design concepts using open source software and equips planners with the tools they need to participate fully in the urban design process.
Planning for Universal Design
Learn the tools for implementing Universal Design in planning regulations.
Smith Gee Studio
City of Charlotte
City of Camden Redevelopment Agency
City of Astoria
Transportation Research & Education Center (TREC) at Portland State University
US High Speed Rail Association
City of Camden Redevelopment Agency
Municipality of Princeton (NJ)