


Evidence-based research can help planners create truly healthy communities. No junk-science please.


Pandemic or not, public health is an important planning issue. Community planning and design decisions can affect a community's health in many ways. These impacts can be large, adding or subtracting years to residents' lives.
Unfortunately, there is a lot of misinformation about these issues. Although I don’t usually criticize colleagues, a good example of bad community health analysis is Kayla Matthew’s recent Planetizen blog, "What Determines the Public Health Outcomes of Cities?," which quotes ratings published by commercial enterprises such as the MINDBODY Wellness Index, which uses “proprietary statistical scoring algorithm" that incorporates data from the Mindbody software; WalletHub’s "Healthiest & Unhealthiest Cities in America," which includes factors such as Gourmet Specialty-Food Stores and Fitness and Instruction Centers per capita; and the ACSM/Anthem Fitness Index, which measures the portion of residents who meet aerobic and strength activity guidelines. Frankly, this is junk science designed primarily to sell products—it treats health as commodity that consumers purchase rather than a community goal—and so provide little practical guidance for planning healthier communities.
To be useful for decision-making, an index should reflect how specific policy and planning decisions (“inputs”) change development patterns and travel activity (“outputs”), and their ultimate economic, social and environmental effects (“outcomes”), as illustrated below.
Steps Between Policy and Planning Decisions and Ultimate Outcomes
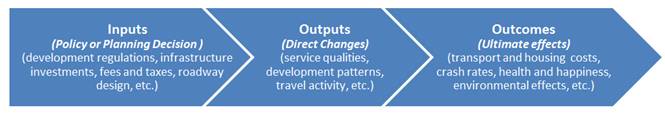
A healthy community index should include a combination of inputs (policy and planning decisions), outputs (development patterns and travel activity), and outcomes (ultimate affordability and health outcomes).
A good index should generally include indicators that reflect a combination of inputs, outputs and outcomes, provided that their relationships are clearly understood, so we can have confidence that a particular policy or planning decision will help achieve community goals. For example, there is plenty of good research indicating that improving a community’s walking conditions (an input) tends to increase walking activity (an output) which reduces cardiovascular disease (an outcome). On the other hand, I know of no credible research indicating that increasing the number of gyms or gourmet specialty-food stores in an area helps improve public health outcomes. Because gyms and gourmet specialty-food stores are costly to use, their prevalence probably tends to increase with income, as does health and longevity, but this correlation does not prove causation. Simply locating more gyms or specialty-food stores will not necessarily make a community healthier, particularly for the most at-risk people.
Health and longevity tend to increase with affluence. Our challenge is to reduce these disparities so physically and economically disadvantaged people can be healthier. For example, the indices promoted by Matthew assume that exercise requires working out at a gym, but for most people, particularly those who are poor and sedentary, the most practical way to exercise is to walk and bike for recreation and utilitarian trips. As a result, to increase overall public fitness and health, and reduce health disparities, communities should improve walking and bicycling conditions and increase neighborhood parks. Similarly, local policy and planning decisions can improve mobility-impaired and low-income residents' access to affordable healthy food, healthcare services and recreation by locating affordable housing in mixed-use urban villages so residents can easily walk to affordable grocery stores, healthcare and recreation facilities.
Good research (Iravani and Rao 2019) indicates that residents of more compact, walkable communities are fitter and healthier than residents of sprawled, automobile-dependent areas, particularly lower-income residents (Rachele, et al. 2018). For example, Frank, et al. (2010) found that adults living in the most walkable neighborhoods walk, bike and take transit 2-3 times more, and drive 58% less than those in more auto-oriented areas; residents of the most walkable areas were half as likely to be overweight than those in the least walkable neighborhoods; and each additional grocery store within a 1-kilometer distance from an individual’s residence was associated with an 11% reduction in the likelihood of being overweight.
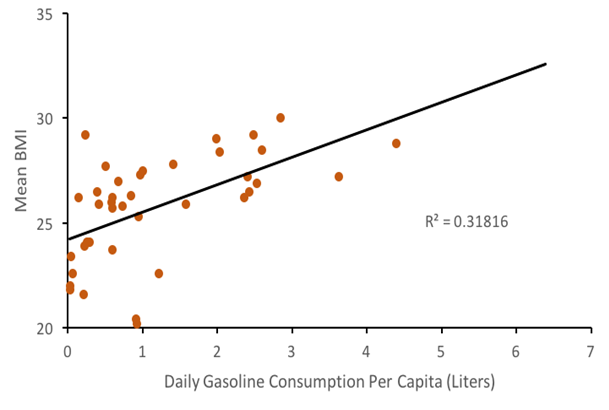
This graph of 40 countries shows a positive relationship between vehicle fuel consumption, and therefore motor vehicle travel, and body mass index (BMI).
In a study of residents in 14 international cities, Sallis, et al. (2016) found that controlling for other factors, net residential density, intersection density, public transport density, and number of parks were significantly, positively related to physical activity. The physical activity differences between residents of the most and least activity-friendly neighbourhoods ranged from 68 to 89 min/week, which represents 45–59% of the 150 min/week recommended by guidelines. This suggests that, to improve public fitness and health, cities should be designed for walkability and ensure that appropriate parks and recreational facilities are located within walking distance of most homes.
A ten-year study in Perth, Australia found that residents overall health improved if they moved from sprawled to more compact, walkable neighborhoods (Giles-Corti, et al. 2013). The study found that for every local shop, residents' physical activity increased an extra 5-6 minutes of walking per week, and for every recreational facility (park, beach, etc.) residents' physical activity increased another 21 minutes per week. Using sophisticated statistical analysis that accounts for various demographic and economic factors, Ewing, et al. (2014) found that Smart Growth is associated with reduced obesity and associated health problems. Similarly, Ewing and Hamidi (2014) found that it increases longevity; doubling their Sprawl Index increased life expectancy approximately 4%, which translates into an average three-year difference in life expectancy between people in less compact versus more compact counties. Increased neighborhood walkability is also associated with improved mental health (Litman 2018), reduced depression (Berke, et al. 2007), and frequency of dementia (Larson, et al. 2006).
Creatore, et al. (2016) found that, accounting for demographic factors such as age, race/ethnicity, education and income, the frequency of self-reported chronic medical conditions such as asthma, diabetes, hypertension and cancer increased with sprawl. Shifting from very sprawled regions such as San Bernardino, California to less sprawled regions such as Boston, Massachusetts reduces approximately 200 chronic medical conditions per 1,000 residents, a 16% reduction. This effect appears to be particularly strong for older and lower-income people.
Hamidi, et al. (2018) used cross-sectional data to evaluate the associations between sprawl and life expectancy for metropolitan counties in the United States in 2010. After controlling for demographic factors the study found significantly higher life expectancy in compact than in sprawling counties. The researchers found that compactness affects mortality both directly, and indirectly, for example, by increasing traffic speeds and emergency response times, and reducing access to health care services and healthy foods. Compactness affects mortality indirectly by increasing total vehicle travel and therefore crash exposure, and by increasing body mass index which contributes to chronic diseases. These findings support further research and practice aimed at identifying and implementing changes to urban planning designed to support health and healthy behaviors.
Iravani and Rao (2019) investigated how the principles of New Urbanism (walkability; connectivity; mixed use and diversity; mixed housing; urban design; traditional neighbourhood structure; density; smart transportation; sustainability; and quality of life) affect public health. Residents in communities that reflect these principles tend to have higher usage of non-motorized and public transit modes, which results in more physical activity; lower usage of private automobiles, which results in less air pollution; safer streets, which results in fewer traffic accidents; and complete community planning for residents, regardless of income, age or ideas, which results in better access to health resources. Together these factors significantly improve public health.
Frederick, Riggs and Gilderbloom (2017), analyzed the relationships between commute mode diversity (the portion of commuters who do not drive an automobile, which ranges from 11% to 36%) an indicator of a multimodal community, and 12 indicators of measure public health and quality of life outcomes for various mid-size U.S. cities and counties. The results indicate that, after adjusting for various demographic factors, there is a strong statistical relationship between more modal diversity and positive public health outcomes including healthier behaviors reported in the Gallup/Healthway’s Well-Being Index, more leisure quality reported by Sperling’s "Cities Ranked and Rated," more access to exercise reported by the Environmental Systems Research Institute, less sedentary living and obesity reported in the Center for Disease Control’s Diabetes Interactive Atlas, fewer Years of Potential Life Lost (an indicator of longevity and overall health), and higher birth weights (an indicator of infant health) reported by the National Center for Health Statistics. These relationships are stronger than many other sociological, geographical, and economic indicators including density, latitude, race, education and income, suggesting that living in a more multimodal community provides significant health benefits. These findings underscore the positive impact of sustainable transportation policies on community health and open up a new direction for public health research and the built environment.
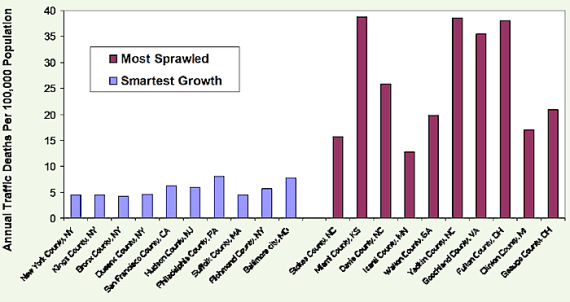
Traffic crash risk is another health factor that is significantly affected by transport and land use planning decisions. Although crashes are a relatively small portion of total deaths, they tend to kill and injure people at a young age, and so cause relatively high number of years of potential life lost. Abundant research indicates that more compact development and more multi-modal transportation systems tends to significantly reduce per capita traffic casualty rates. For example, accounting for demographic and geographic factors (income, fuel prices and compactness) in 147 U.S. urban regions, Yeo, Park and Jang (2015) found that per capita traffic fatality rates increase with sprawl, apparently due to a combination of increased vehicle travel, higher traffic speeds and slower emergency response. Similarly, Ahangari, Atkinson-Palombo and Garrick (2017) found that traffic death rates decline with urban densities.
Najaf, et al. (2018) find that an urban area’s per capita crash rates decline with more job-housing balance, more polycentric design, increased population density and less low-density sprawl, improving transportation network connectivity, more public transit facilities, and grade-separated highways. They conclude that these safety gains result primarily from reductions in per capita vehicle travel and traffic speeds. They estimate that, all else being equal, a 10% increase in urban density or the spatial distribution of employment reduces fatal crash rates by >15%, a 10% increase in network connectivity increases traffic safety 4.13%, and a 10% increase in public transit supply reduces fatalities 8.28%.
Higher fuel, road and parking pricing can also increase traffic safety. A comprehensive study of 14 industrialized countries found that a 10% gasoline price decline caused road fatalities to increase 2.19% (Ahangari, et al. 2014). Burke and Nishitateno (2015) found that a 10% fuel price increase typically reduces traffic deaths by 3-6%, and estimate that removing global fuel subsidies would reduce approximately 35,000 annual road deaths worldwide.
Complete streets roadway design and road diets tend to increase travel safety, particularly for pedestrians and bicyclists, and by improving active and public transportation, reduce total vehicle travel and accidents. Compared with sprawled, automobile-oriented development, more connected and multi-modal complete streets designs can reduce local crash casualty rates 10-30% (Marshall, Ferenchak and Janson 2018). Similarly, Mohan, Bangdiwala and Villaveces (2017) found that, all else being equal, more roadway junctions and fewer kilometers of arterial grade roadways are associated with lower motor-vehicle and pedestrian traffic death rates.
Planning decisions can affect physically and economically disadvantaged people’s ability to access health-related goods and services, such as healthcare, healthy food and recreation. Transportation problems contribute to about a quarter of missed medical appointments (Silver, Blustein, and Weitzman 2012). One survey found that 4% of children (3.2 million) either missed a scheduled health care visit, or did not schedule a visit, during the preceding year because of transportation restrictions (Redlener, et al. 2006). Similarly, inadequate travel options can prevent some households from accessing healthy food, exercise and sports activities, or other services and activities that contribute to health.
Efficient, affordable and inclusive transportation, and compact development, tend to increase economic mobility: the chance that a child born in a lower-income household becomes more economically successful as an adult (Bouchard 2015). Ewing, et al. (2016) found that Smart Growth increases economic mobility (the chance that children born in low-income families will become economically successful as adults); doubling their compactness index increases the probability that a child born to a family in the bottom income quintile will reach the top quintile by age 30 by about 41%.
This research indicates that comprehensive planning for community health should consider physical activity and fitness, traffic crash risks, pollution exposure, housing and transportation affordability (which leaves low-income households with more money to spend on healthy food and healthcare), mental health, access to healthy and affordable food, and access to healthcare services, as summarized in the table below.
Health Impacts Summary
Community Health Factor |
Policies for Health |
|
Physical activity(target is at least 22 daily minutes of moderate activity). |
Improve and encourage active modes (walking and bicycling). More affordable housing in walkable neighborhoods. More neighborhood parks. |
|
Traffic crash risks(per capita crash casualty rates). |
Targeted traffic safety programs and vehicle travel reduction strategies. |
|
Air pollution exposure(ambient pollution levels in residential areas) |
Vehicle emission reduction strategies. Separate people from vehicle traffic. |
|
Affordability(portion of household budgets that must be spent on housing and transport) |
Improve affordable modes (walking, bicycling, ridesharing and public transit) and affordable housing in accessible locations. |
|
Mental Health(insecurity and social isolation). |
Create safer, more walkable (for exercise and community cohesion), and more affordable communities. |
|
Access to healthy food(proximity to grocery stores and mobility options for disadvantaged people). |
More affordable housing in compact and mixed development. Better walking, bicycling and public transit services. |
|
Access to healthcare services(proximity and affordability of healthcare services, and quality of mobility options for disadvantaged people). |
Improve affordable travel options. Better housing options in walkable neighborhoods. Identify and address barriers to healthy food and healthcare. |
Although these health objectives are diverse, they overlap in many ways. Many health risks (accidents, pollution emissions, sedentary lifestyles, inaffordability, etc.) tend to decline, and residents tend to be healthier in more multimodal, compact communities. As a result, multi-modal planning, Smart Growth development policies, and Transportation Demand Management programs tend to achieve multiple health objectives.
For More Information
CPSTF (2017), Physical Activity: Built Environment Approaches Combining Transportation System Interventions with Land Use and Environmental Design, Community Preventive Services Task Force (www.thecommunityguide.org).
Maria I. Creatore, et al. (2016), “Association of Neighborhood Walkability with Change in Overweight, Obesity, and Diabetes,” JAMA, Vol. 315, No 20, 2211 (DOI:10.1001/jama.2016.5898).
Reid Ewing, et al. (2014), “Relationship Between Urban Sprawl and Physical Activity, Obesity, and Morbidity – Update And Refinement,” Health & Place, Vol. 26, March, pp. 118-126.
Chad Frederick, William Riggs and John Hans Gilderbloom (2017), “Commute Mode Diversity and Public Health: A Multivariate Analysis of 148 US Cities,” International Journal of Sustainable Transportation.
Billie Giles-Corti, et al. (2016), “City Planning and Population Health: a Global Challenge,” The Lancet, (ttp://dx.doi.org/10.1016/S0140-6736(16)30066-6).
Shima Hamidi, et al. (2018), “Associations between Urban Sprawl and Life Expectancy in the United States,”International Journal of Environmental Research and Public Health, Vol. 15/5 (doi:10.3390/ijerph1505086)
Building Healthy Places Initiative (http://americas.uli.org/health) is an Urban Development Institute program to develop tools to create healthier communities.
Hamid Iravani and Venkat Rao (2019), “The Effects of New Urbanism on Public Health,” Journal of Urban Design (DOI: 10.1080/13574809.2018.1554997).
Todd Litman (2017), A New Traffic Safety Paradigm, Victoria Transport Policy Institute (www.vtpi.org).
Avila Palencia (2018), “The Effects of Transport Mode Use on Self-Perceived Health, Mental Health, and Social Contact Measures: A Cross-Sectional and Longitudinal Study,” Environment International, Vol. 120, pp. 199-206.
James F. Sallis, et al. (2016), “Physical Activity in Relation to Urban Environments in 14 Cities Worldwide: A Cross-Sectional Study,” The Lancet, Vol. 387, No. 10034, pp. 2207–2217.
Marc Schlossberg, John Rowell, Dave Amos and Kelly Sanford (2013), Rethinking Streets: An Evidence-Based Guide to 25 Complete Street Transformations, University of Oregon's Sustainable Cities Initiative (http://sci.uoregon.edu).
TAC (2019), Integrating Health and Transportation in Canada, PTM-IHTC-E, Transportation Association of Canada (www.tac-atc.ca).
Urban Design for Health (http://urbandesign4health.com) develops practical tools for incorporating health objectives into community planning, including the National Environmental Database which includes built, natural and social environmental health performance indicators.
Ben Welle, et al. (2018), Sustainable & Safe: A Vision and Guidance for Zero Road Deaths, World Resources Institute (www.wri.org) and Global Road Safety Facility (www.worldbank.org/grsf).

Unleashing the Power of Cycling With Smart Messaging
Lloyd Alter describes how creative design and copywriting can flip the script and promote active transport.

Pensacola Launches Active Transportation Plan
Pensacola, Florida, one of the least safe localities for pedestrians in a state full of them, is seeking public feedback for a new Active Transportation Plan.

Let’s End Traffic Stops
The technology to make traffic enforcement obsolete is becoming available. But in the U.S. willing to use it?

Planetizen Federal Action Tracker
A weekly monitor of how Trump’s orders and actions are impacting planners and planning in America.

Maui's Vacation Rental Debate Turns Ugly
Verbal attacks, misinformation campaigns and fistfights plague a high-stakes debate to convert thousands of vacation rentals into long-term housing.

San Francisco Suspends Traffic Calming Amidst Record Deaths
Citing “a challenging fiscal landscape,” the city will cease the program on the heels of 42 traffic deaths, including 24 pedestrians.

Defunct Pittsburgh Power Plant to Become Residential Tower
A decommissioned steam heat plant will be redeveloped into almost 100 affordable housing units.

Trump Prompts Restructuring of Transportation Research Board in “Unprecedented Overreach”
The TRB has eliminated more than half of its committees including those focused on climate, equity, and cities.

Amtrak Rolls Out New Orleans to Alabama “Mardi Gras” Train
The new service will operate morning and evening departures between Mobile and New Orleans.
Urban Design for Planners 1: Software Tools
This six-course series explores essential urban design concepts using open source software and equips planners with the tools they need to participate fully in the urban design process.
Planning for Universal Design
Learn the tools for implementing Universal Design in planning regulations.
Heyer Gruel & Associates PA
JM Goldson LLC
Custer County Colorado
City of Camden Redevelopment Agency
City of Astoria
Transportation Research & Education Center (TREC) at Portland State University
Jefferson Parish Government
Camden Redevelopment Agency
City of Claremont