Maps

Making a Regional Map of Walking and Biking Trails
A cross-jurisdictional trail map is harder to find than one might expect. Not so anymore in the Washington, D.C. region.
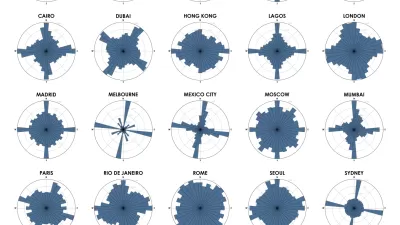
Chart Your City's Street Network to Understand its Logic
The roads in your city might conform to a grid, or they might divert around natural resources or landmarks. A new tool aims to help you visualize the "hidden logic" behind urban growth.
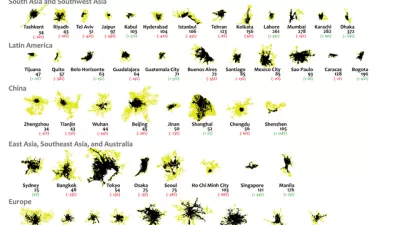
Mapping 25 Years of Urban Expansion
What comparing 25 years of urban expansion on six continents reveals about the changing nature of the built environment.

Mapping All of San Francisco's Transit-Related Projects
A new interactive map keeps residents up to date on where the San Francisco Municipal Transportation Agency is working on new projects.

Mapping All the Land Uses in the Lower 48
A massive data visualization project illuminates the land uses that define the United States.

Seeking 'Opportunity Zones' Investments
The city of Louisville is making the most of the Opportunity Zone program in the early stages of the new federal program.

A Map of 'Smoke Events' Around the World
Fire season is back, and it's not safe to breathe in huge swaths of the world.

A Map of Resources for Low-Income Philadelphians
The Broke in Philly initiative has created a map aimed at making it easier to access support and services for low-income residents of Philadelphia.

Friday Eye Candy: Making Subway Lines Visible From an Airplane
The transit map is useful, but doesn't always capture the scale of the engineering feat that produced the world's subways systems.
Three Ways to Make GIS as Powerful as Possible
These days, cities are expected to make the most of open data and spatial visualization technologies.

A Map of the 'Mellow' Bike Routes Around Chicago
Not all bike routes are created equal; some are just mellower.

Interactive Maps Explore Barriers to Opportunity
A pair of interactive maps and a report compare access to opportunity in two very different neighborhoods. In both places, residents confront "friction of distance" and feel their input on public decision-making is limited.

California Evictions Much Faster and More Frequent Than Previously Thought
About 500,000 tenants face eviction every year—triple previous estimates. And over a million may be involuntary displaced despite never making it to court.

Friday Fun: Choose the Best in the 'World Cup of Transit Maps'
The perennial debate is renewed, and potentially resolved: Which city's metro system has the best transit map?
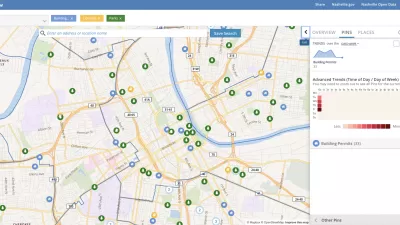
Presenting Municipal Data in an Interactive Map, Nashville Style
The city of Nashville launched the NashView interactive data map earlier this month.

Mapping Potential 'Opportunity Zones'
The GOP tax reform bill enabled a potentially powerful new funding mechanism for struggling communities.

Mapping the Collision Course of Sprawl and Biodiversity
The expansion of the built environment proceeds with little regard for the loss of biodiversity, and the planning field isn't doing enough to help.

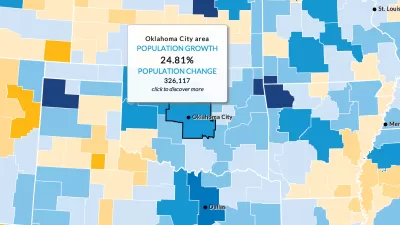
Mapping the Fastest Growing Companies in the United States
Here's a helpful tool for understanding economic growth.

Mapping the LGBTQ-Friendliness of the World's Cities
A colorful data visualization tool maps information about which cities have the most protections for LGBTQ people in place. The tool is intended as a resource for LGBTQ travelers.

'Renewing Inequality': Mapping the Scars of Urban Renewal
A new interactive maps brings a visual reality to the scale of displacement effected by urban renewal of the 1950s and 1960s.
City of Costa Mesa
Licking County
Barrett Planning Group LLC
HUD's Office of Policy Development and Research
Mpact Transit + Community
HUD's Office of Policy Development and Research
Tufts University, Department of Urban and Environmental Policy & Planning
City of Universal City TX
ULI Northwest Arkansas
Urban Design for Planners 1: Software Tools
This six-course series explores essential urban design concepts using open source software and equips planners with the tools they need to participate fully in the urban design process.
Planning for Universal Design
Learn the tools for implementing Universal Design in planning regulations.