


A 9 percent increase in fatalities on the nation's highways compared to the same period in 2015 does not appear to be a result of increased driving, which jumped 3.3 percent during that period, but rather an increase in the rate of fatal crashes.
Note the rising red line beginning in 2014 in the National Safety Council chart below that accompanied their Aug. 23 press release:

The fatality rate increased from 1.2 deaths per 100 million vehicle miles traveled to 1.3 deaths, an increase of 8.3 percent, just shy of the percentage increase in total deaths. On Aug. 22, the Federal Highway Administration reported that total mileage driven the first six months of 2016 increased 3.3 percent.
NSC estimates that 2.2 million people were seriously injured (requiring medical attention) during the first six months of the year.
The report casts an ominous sign for the coming Labor Day holiday weekend. National Safety Council (NSC) estimates [PDF] that 438 people will die during the upcoming three-day holiday weekend, the most since 2008.
The data are estimates
NSC lowered their Aug. 17, 2015 estimate of traffic fatalities for the first 6 months of 2015 from 18,600, a 14 percent increase over 2014, to 17,530. Last year at this time NSC projected that fatalities were "on track to exceed 40,000 traffic deaths." The increase was in fact 8 percent, and the year's total was 38,300.
Readers may be curious about the discrepancy with reporting from the National Highway Traffic Safety Administration, which estimated 2015 fatalities at 35,200 in their July report. NSC uses a different database than NHTSA, as our February post on an NSC report explains.
If the trend continues, "which shows no signs of decreasing...the U.S. may see its deadliest driving year since 2007 and deadliest Labor Day since 2008," according to the 100-year-old group.
A supplemental Motor Vehicle Fatality Estimate sheet [PDF] projects the year-end total at 39,870 [Table 1.]
According to NSC, the three main causes of traffic fatalities last year were:
- Alcohol (30.8%). [Note: Driving under the influence of drugs is a major factor as well.]
- Speeding (30%)
- Distracted driving (26%)
"States that have been particularly hard hit since 2014, the start of the upward trend, are Florida (43% increase), Georgia (34%), Indiana (33%), California (31%), North Carolina (26%), Illinois (24%) and Kentucky (24%)," reports NSC. [See Table 2 (PDF) for precise data].
Last September, the Sacramento Bee (via Planetizen) distinguished the increase in miles traveled from the increase in fatalities. Traffic deaths in the nation's most populous state have been on the risen since 2010 after decreasing from 2006 to 2010.
"In some ways, the connection seems obvious: More people on the roads means more fatal encounters," wrote Tony Bizjak.
But state highway officials say that doesn’t have to be the case. Having more cars on the roads doesn’t always lead to more crashes. In some instances, crowded roads can make driving safer by forcing motorists to slow down and pay more attention. (For instance, crash rates on rural roads are higher than on urban streets.)
For additional media accounts on the National Safety Council report, see AP and Streetsblog.
FULL STORY: Motor Vehicle Fatalities Up 9%; No Sign of a Decrease in 2016, says National Safety Council
2015 Road Toll: 35,200 Fatalities
The National Highway Traffic Safety Administration (NHTSA) released preliminary fatality estimates for 2015. Deaths jumped by 2,525, an increase of 7.7 percent over 2014. Pedestrians and bicyclists saw the biggest increases.
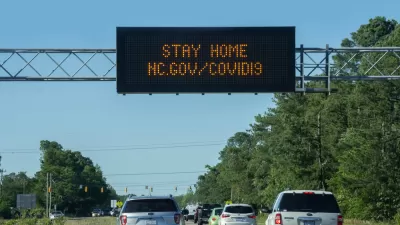
As the Pandemic Rages, Carnage on U.S. Roads
Increased stress, increased speeds, more drinking and driving—whatever the reason, traffic fatalities are climbing rapidly even as more Americans leave the car parked at home.
Fatal Collisions Increase Per Vehicle Miles Traveled During Pandemic
Data from the National Safety Council show the first evidence that with fewer cars on the road during the pandemic, fatal collisions have actually been more common for every mile driven.
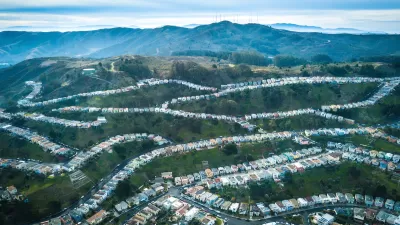
Depopulation Patterns Get Weird
A recent ranking of “declining” cities heavily features some of the most expensive cities in the country — including New York City and a half-dozen in the San Francisco Bay Area.
California Exodus: Population Drops Below 39 Million
Never mind the 40 million that demographers predicted the Golden State would reach by 2018. The state's population dipped below 39 million to 38.965 million last July, according to Census data released in March, the lowest since 2015.
Chicago to Turn High-Rise Offices into Housing
Four commercial buildings in the Chicago Loop have been approved for redevelopment into housing in a bid to revitalize the city’s downtown post-pandemic.

Twin Cities Trains Move to Fewer Cars, Higher Frequency
Headways will drop from 15 minutes to 12 minutes.

DC Bikeshare System Breaks Ridership Record
Capital Bikeshare users took over 20,000 rides on one day in March.

EV Infrastructure Booming in Suburbs, Cities Lag Behind
A lack of access to charging infrastructure is holding back EV adoption in many US cities.
Barrett Planning Group LLC
City of Cleburne
KTUA Planning and Landscape Architecture
HUD's Office of Policy Development and Research
Mpact Transit + Community
HUD's Office of Policy Development and Research
City of Universal City TX
ULI Northwest Arkansas
City of Laramie, Wyoming
Urban Design for Planners 1: Software Tools
This six-course series explores essential urban design concepts using open source software and equips planners with the tools they need to participate fully in the urban design process.
Planning for Universal Design
Learn the tools for implementing Universal Design in planning regulations.