


A new animated map presents the reported cases of potholes in Chicago since November—the maps colorful and provides insights into how the city, and our relationship to it, can change with time.
Vikki Ortiz Healy reports for the Chicago Tribune about a new animated map of pothole reports from November to this week in the city of Chicago. To create the map, Elliott Ramos downloaded data from the city of Chicago’s website, “which meticulously documents all pothole reports.”
The map blinks like a Christmas tree as the number and density of reported potholes expands and contracts with time. January through February, for instance, might require sunglasses for viewing given the density of reported potholes.
According to Healy’s article, Ramos created the visualization to help residents understand the nuances of how data manifests around the city. “At a wide glance, Ramos’ map, which took him less than an hour to create, shows an orange dot for each pothole report. The orange fades to yellow/pink as time elapses. The point, he said, is to demonstrate how the number of pothole reports changes over time, and that there can be days with a surge of reportings — such as just after Jan. 1 or at Jan. 15 — perhaps when more people are home to notice or are inspired by media reports,” writes Healy.
FULL STORY: Where are the most pot holes in the city? There's an app for that.
A Central Hub for Open Data
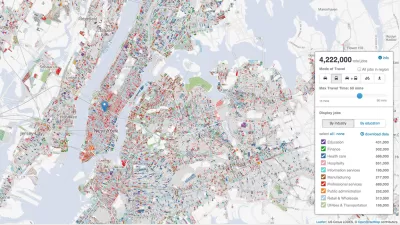
Designed by researchers at the University of Chicago, the Plenario platform gathers all available open data for a specific area. Then it presents the data in an easy-to-use format.
The Growing Importance of Location Intelligence
Location intelligence is transforming decision-making, with an increasing number and type of organizations modernizing operations with a geographic approach to problem-solving, planning, and prediction.

Real-Time Art Installation Reveals the Many Dimensions of Data
Using a wagon filled with phones, an artist in Berlin demonstrated the disconnect between data and the real world.

Pennsylvania Mall Conversion Bill Passes House
If passed, the bill would promote the adaptive reuse of defunct commercial buildings.

Coming Soon to Ohio: The Largest Agrivoltaic Farm in the US
The ambitious 6,000-acre project will combine an 800-watt solar farm with crop and livestock production.

World's Largest Wildlife Overpass In the Works in Los Angeles County
Caltrans will soon close half of the 101 Freeway in order to continue construction of the Wallis Annenberg Wildlife Crossing near Agoura Hills in Los Angeles County.

California Grid Runs on 100% Renewable Energy for Over 9 Hours
The state’s energy grid was entirely powered by clean energy for some portion of the day on 37 out of the last 45 days.

New Forecasting Tool Aims to Reduce Heat-Related Deaths
Two federal agencies launched a new, easy-to-use, color-coded heat warning system that combines meteorological and medical risk factors.

AI Traffic Management Comes to Dallas-Fort Worth
Several Texas cities are using an AI-powered platform called NoTraffic to help manage traffic signals to increase safety and improve traffic flow.
City of Costa Mesa
Licking County
Barrett Planning Group LLC
HUD's Office of Policy Development and Research
Mpact Transit + Community
HUD's Office of Policy Development and Research
Tufts University, Department of Urban and Environmental Policy & Planning
City of Universal City TX
ULI Northwest Arkansas
Urban Design for Planners 1: Software Tools
This six-course series explores essential urban design concepts using open source software and equips planners with the tools they need to participate fully in the urban design process.
Planning for Universal Design
Learn the tools for implementing Universal Design in planning regulations.