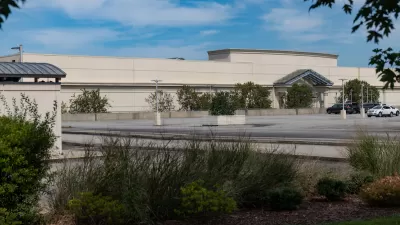
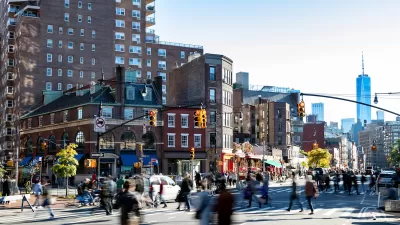
I recently finished reading Foreclosing the Dream, by William Lucy. The most interesting parts of this book are the first chapter and the last appendix, both of which tell us where foreclosures are (or at least were in 2008, before the foreclosure crisis morphed into an international economic downturn). These figures seem to me to debunk at least a couple of the more popular explanations of the foreclosure crisis, such as: Myth 1: "Its all the fault of too much lending to the urban poor."
I recently finished reading Foreclosing the Dream, by William Lucy. The most interesting parts of this book are the first chapter and the last appendix, both of which tell us where foreclosures are (or at least were in 2008, before the foreclosure crisis morphed into an international economic downturn). These figures seem to me to debunk at least a couple of the more popular explanations of the foreclosure crisis, such as:
Myth 1: "Its all the fault of too much lending to the urban poor."
Fact: In the states most affected by foreclosures (such as California and Florida) "drive to qualify" middle-class outer suburbs had far more foreclosures than urban counties. In Northern California, only 0.2% of San Francisco's housing units were in foreclosure or preforeclosure status, as opposed to 3.3% in Contra Costa County and 3.7% in Solano County. In fact, San Francisco had the lowest foreclosure level of any San Francisco-area county. Alameda County (which includes Oakland) had a less impressive 1.8% foreclosure rate- but even that rate was below not only the suburban counties mentioned above, but the statewide average of 2.5%. Similarly, in Southern California, Los Angeles County's 1.4% foreclosure rate was far below that of drive-to-qualify Riverside County (4.4%) and San Berardino (4.0%).
And in South Florida, only 1.1% of housing units in Dade County (the most urban-like of Southeast Florida's three not-very-urban counties) were in foreclosure/preforeclosure status, as opposed to 3.9% in neighboring Broward County.
(Sort of) Myth 2: "Its all of the fault of high housing prices."
This is not a complete myth, which is why I call it a "sort of" myth: most 2008 foreclosures occurred in just four states (California, Florida, Neveda, Arizona). All of these states had median housing value/median family income ratios above the national average- almost 8-1 in California, 5-1 in Neveda, 4-1 in the other two states.
But other expensive states, mostly in the Northeast and Pacific Northwest, had comparable housing/income ratios and much lower foreclosure rates. For example, in New Jersey, 2007 housing prices were 4.6 times family income. Yet only 0.4% of housing units were in foreclosure/preforeclosure status, below the 0.8% national average.
If uses changes in housing/income ratios over the 2000s (to distinguish between places that became expensive more rapidly and those that were always expensive), one finds similar results. The "Big Four" states had increases ranging between 57% (Arizona) and 97% (California)- among the highest in the nation, but not significantly different from low-foreclosure states such as New Jersey (76%), Rhode Island (68%) or Maryland (75%).
So what does make these four states different from all others? Anyone want to explain?

Pennsylvania Mall Conversion Bill Passes House
If passed, the bill would promote the adaptive reuse of defunct commercial buildings.

Planning for Accessibility: Proximity is More Important than Mobility
Accessibility-based planning minimizes the distance that people must travel to reach desired services and activities. Measured this way, increased density can provide more total benefits than increased speeds.

World's Largest Wildlife Overpass In the Works in Los Angeles County
Caltrans will soon close half of the 101 Freeway in order to continue construction of the Wallis Annenberg Wildlife Crossing near Agoura Hills in Los Angeles County.

How Transit Architecture Impacts Real and Perceived Safety
More than a third of Americans believe major transit systems are too unsafe to ride. The built environment can change that.

New York Passes Housing Package Focused on New Development and Adaptive Reuse
The FY 2025 budget includes a new tax incentive, funding for affordable housing on state land, and support for adaptive reuse and ADUs.

LA Metro Board Approves New 710 Freeway Plan
The newest plan for the 710 corridor claims it will not displace any residents.
City of Costa Mesa
Licking County
Barrett Planning Group LLC
HUD's Office of Policy Development and Research
Mpact Transit + Community
HUD's Office of Policy Development and Research
Tufts University, Department of Urban and Environmental Policy & Planning
City of Universal City TX
ULI Northwest Arkansas
Write for Planetizen
Urban Design for Planners 1: Software Tools
This six-course series explores essential urban design concepts using open source software and equips planners with the tools they need to participate fully in the urban design process.
Planning for Universal Design
Learn the tools for implementing Universal Design in planning regulations.


