


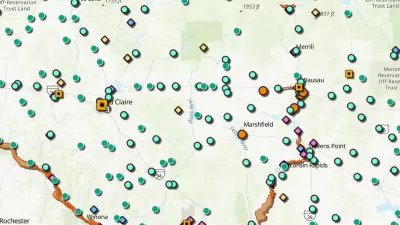
GIS maps are being used to identify where communities need services -- and whether some communities are victims of municipal discrimination.
"The Cedar Grove Institute has been using maps to exhibit patterns of municipal discrimination against low-income and minority communities for almost a decade. The patterns, rooted in the days when residential discrimination was supported by law, have been reinforced under the cover of such contemporary land-use mechanisms as annexation, zoning and extra-territorial controls.
To produce the maps, the institute employs geographic information systems technology, a computer-based tool for organizing, analyzing and displaying data in a spatial or geographic context. While the maps seem simple, producing them is anything but. Data must be collected from a host of sources, including government databases, door-to-door surveys and Global Positioning System devices. The data is digitized, analyzed, converted to images and layered together in various combinations."
FULL STORY: The Revolution Will Be Mapped
New Book Highlights How GIS Improves Outcomes
Esri Press recently published a digital book called Mapping the Nation which demonstrates how a geographic approach guides important decisions and addresses challenges around the globe.

Map Identifies DeKalb County Brownfield Sites
The GIS tool is designed to help developers find vacant and blighted lots that could be restored for new housing or other uses.
The Growing Importance of Location Intelligence
Location intelligence is transforming decision-making, with an increasing number and type of organizations modernizing operations with a geographic approach to problem-solving, planning, and prediction.

Pennsylvania Mall Conversion Bill Passes House
If passed, the bill would promote the adaptive reuse of defunct commercial buildings.

Coming Soon to Ohio: The Largest Agrivoltaic Farm in the US
The ambitious 6,000-acre project will combine an 800-watt solar farm with crop and livestock production.

World's Largest Wildlife Overpass In the Works in Los Angeles County
Caltrans will soon close half of the 101 Freeway in order to continue construction of the Wallis Annenberg Wildlife Crossing near Agoura Hills in Los Angeles County.

California Grid Runs on 100% Renewable Energy for Over 9 Hours
The state’s energy grid was entirely powered by clean energy for some portion of the day on 37 out of the last 45 days.

New Forecasting Tool Aims to Reduce Heat-Related Deaths
Two federal agencies launched a new, easy-to-use, color-coded heat warning system that combines meteorological and medical risk factors.

AI Traffic Management Comes to Dallas-Fort Worth
Several Texas cities are using an AI-powered platform called NoTraffic to help manage traffic signals to increase safety and improve traffic flow.
City of Costa Mesa
Licking County
Barrett Planning Group LLC
HUD's Office of Policy Development and Research
Mpact Transit + Community
HUD's Office of Policy Development and Research
Tufts University, Department of Urban and Environmental Policy & Planning
City of Universal City TX
ULI Northwest Arkansas
Urban Design for Planners 1: Software Tools
This six-course series explores essential urban design concepts using open source software and equips planners with the tools they need to participate fully in the urban design process.
Planning for Universal Design
Learn the tools for implementing Universal Design in planning regulations.